Abstract
This section contains information about using colors in PHPlot. Functions described in Section 4.3, “Colors and Line Styles” in the Reference chapter control the use of colors in PHPlot.
Individual colors as arguments to PHPlot functions can take one of the following forms:
A color name, as defined by SetRGBArray or from a built-in color map if SetRGBArray was not called. Note that color names are case sensitive.
Numeric color component values, in the form
#rrggbb. Here rr is red, gg is green, and bb is blue, and each component value is represented as a 2-digit hexadecimal number between 00 and ff. For example,#0000ffis full-saturation blue.A PHP array of red, green, and blue color component values, each value being in the range 0 to 255 inclusive, for example
array(0,0,255)for blue.
Note
You cannot use the (red, green, blue) array form as a color value in those functions (like SetDataColors) which accept either a single color or an array of colors. The functions are unable to distinguish between an array of colors and a single color represented as an array.
There are 36 colors defined in the 'small' internal color map. This is the set of colors available by default, unless SetRGBArray is used to load in a different color map. The colors and their names are shown in the figure below.
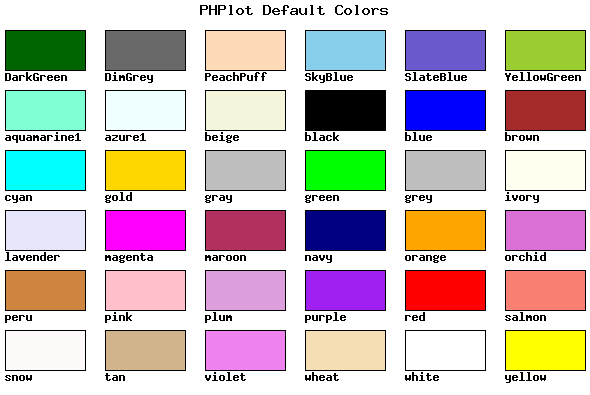
Here are the color names again, in case the above figure is unavailable.
| DarkGreen | DimGrey | PeachPuff | SkyBlue | SlateBlue | YellowGreen |
| aquamarine1 | azure1 | beige | black | blue | brown |
| cyan | gold | gray | green | grey | ivory |
| lavender | magenta | maroon | navy | orange | orchid |
| peru | pink | plum | purple | red | salmon |
| snow | tan | violet | wheat | white | yellow |
The color names and values in the 'small' internal color map are selected from the X11 RGB Color Database. If you use SetRGBArray to pick the 'large' color map, PHPlot loads a much larger list of colors equivalent to the entire X11 RGB Color Database. Note that there are some duplicate colors in the maps, as they include alternate spellings (like 'gray' and 'grey').
Each data set plotted on a graph uses the next color in the Data Colors list. By default, the Data Colors list contains the following eight colors in order: SkyBlue green orange blue orange red violet azure1
If plotting more than four data sets, you should use SetDataColors to define your own data colors list. Otherwise you will get two data sets plotted in the same color, orange. (This might be a bug.)
You can designate one color in the color map to be transparent. This is most often used to make a plot with a transparent background. Use SetTransparentColor to designate the color, and SetBackgroundColor to use that color for the background. Use a color which is not otherwise used in the plot.
For transparency to work, the output format (see SetFileFormat) must support transparency, and the the user's viewer or browser also must support transparency. If transparency is not supported, the user will see the actual color which was designated as transparent (so don't use red, for example). Most viewers support transparency in GIF format, and newer viewers should support transparency in PNG format. JPEG format does not support transparency.